NPK recommendations
& yield prediction,
field by field.

Enter soil data and crop type. Get N, P, K doses in kg/ha, a yield estimate, and a growth simulation computed from your field.

  • 14k+Reference points
  • 11Regions covered
  • CalibratedRegional confidence
Field context9.5614°N · 2.1421°E
Active context
Soil summary
pH6.4Slightly acidic
EC1.2dS/m
Organic carbon1.2%Low
TextureSandy loam ›Balanced
Yield estimate

Expected: 4.2 t/ha — range 3.6–4.8
Capabilities

Four modules: from soil measurements to an NPK plan in kg/ha.

Each module can be used independently. Together they cover the full cycle: simulate yield with WOFOST 8.1, derive an NPK plan in kg/ha, run nitrogen scenario simulations, and query the recommendation reasoning.

01 · predict

Yield prediction

Estimate final grain yield for a selected crop and location using local soil, weather, and management information. The system provides an expected yield value together with an uncertainty range to support agronomic decision-making.

Predicted yield · t/ha · site-specific estimate
02 · Plan

NPK recommendation

Derives N, P₂O₅ and K₂O doses (kg/ha) from the predicted yield gap and the crop's nutrient demand curve. Each dose is cross-referenced against regional anchor observations to bound the recommendation.

N96
P42
K58
kg/ha · per crop · per stage · per region
03 · Simulate

Scenario simulation

Run WOFOST 8.1 with EnKF across multiple N doses (kg/ha) and read the resulting TWSO curves and LAI trajectories side by side. Identify the dose where yield gain no longer justifies the input cost.

High N
Optimalrec
Low N
WOFOST 8.1 · EnKF · TWSO · LAI
04 · Query

Agronomic agent

Ask questions about a recommendation in plain language. The agent returns the underlying indicators, the comparable reference points, and the prediction interval. No opaque outputs, full traceability.

What NPK doses for my maize field - soil pH 6.4, V6 stage?
Recommendation for maize V6, semi-arid zone: N 96 kg/ha, P₂O₅ 48 kg/ha, K₂O 32 kg/ha. Calibrated to WAF-04 anchor region - confidence 0.91.
Traceable · regionally contextualised
npk-platform  /  dashboard  /  simulation
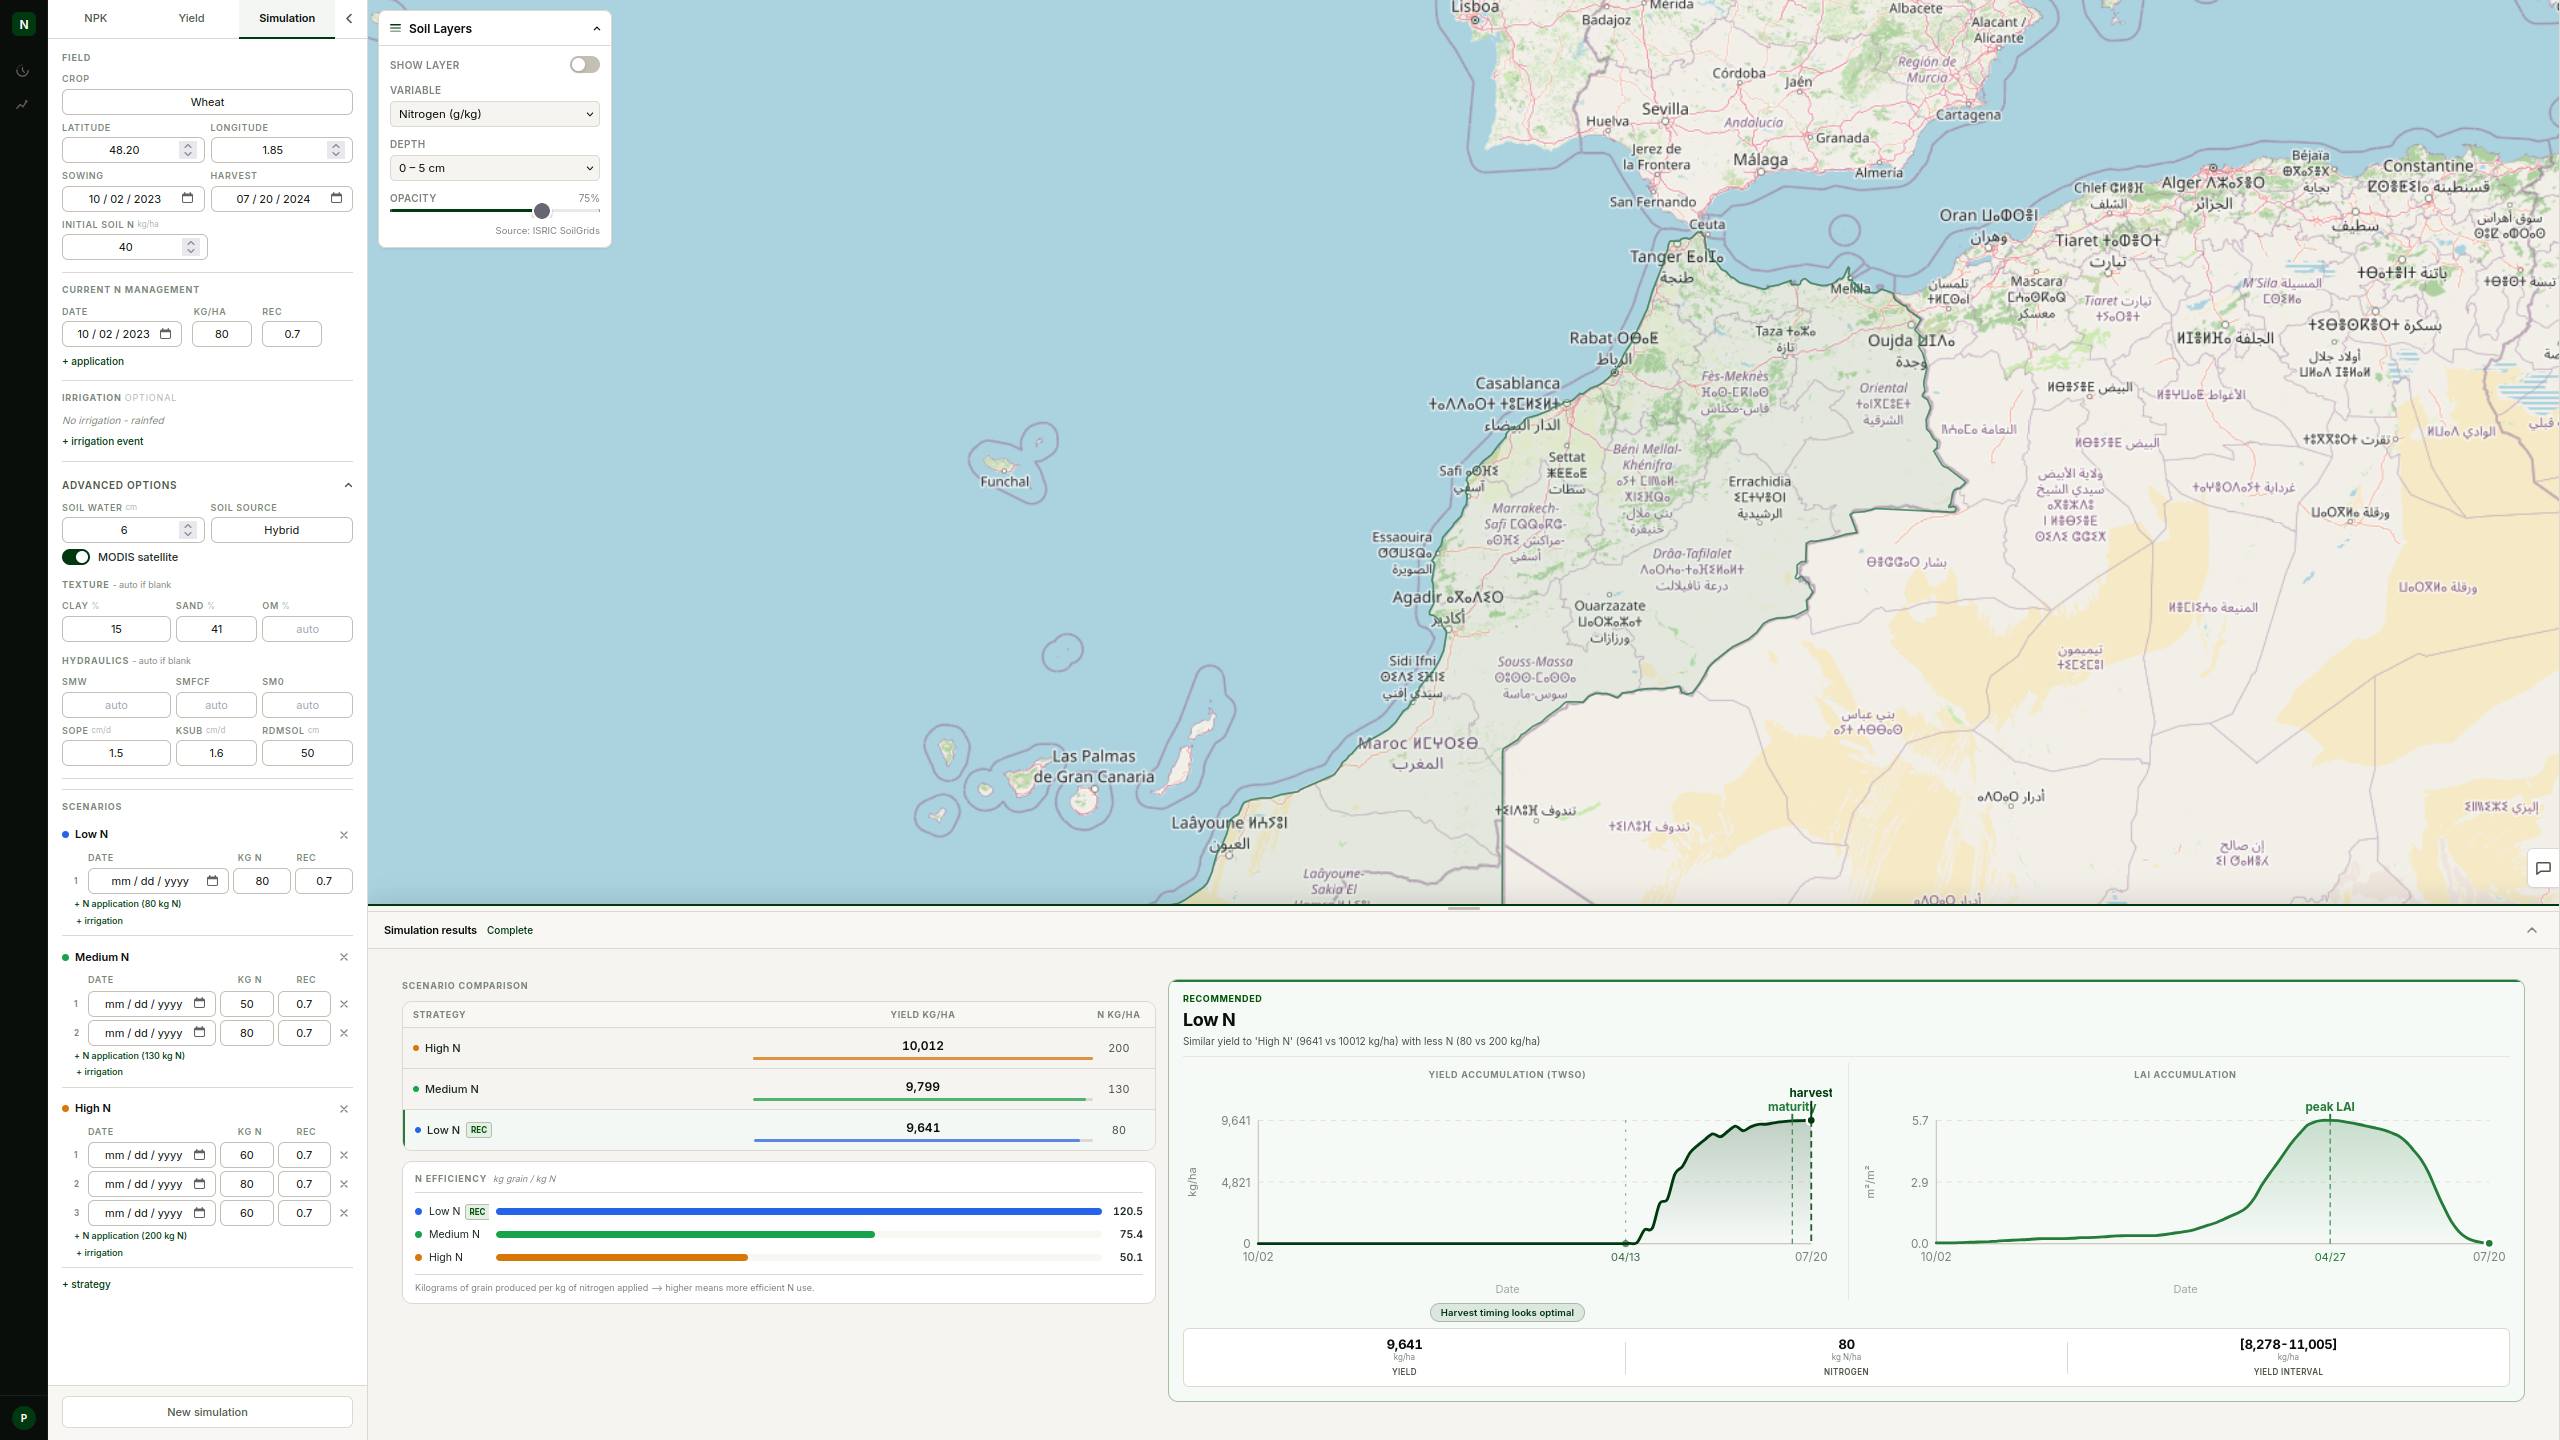
NPKPlatform simulation interface showing the map, scenario comparison panel and TWSO yield accumulation curve
Platform output

The interface, as it runs in the field.

Select a coordinate on the map, configure the crop and N management parameters, then run the WOFOST 8.1 simulation. Results appear below the map: a scenario comparison table with yield bars and a TWSO accumulation curve tracking growth day by day through the season.

Interactive map covering Morocco, West Africa and surrounding regions
Soil layers panel: pH, organic carbon, clay and sand fractions from regional datasets
Scenario comparison: multiple N doses run in parallel, yield bars side by side
TWSO accumulation curve tracking grain yield day by day, with harvest marker and confidence interval
4+N scenarios per run
DailyTWSO and LAI resolution
kg/haStandard agronomic output
EnKFEnsemble uncertainty

Enter a coordinate. Get an NPK plan in kg/ha.

Run yield predictions, derive nutrient doses in kg/ha, and compare nitrogen strategies using WOFOST 8.1 simulations. All from a single field point.